Evaluation of Possible Agricultural Damage from Alleged Herbicide Drift from a Crop Duster
Overview
This litigation case dealt with alleged herbicide drift of pesticides from a crop duster, with consequent damage over young tomato plantings (claims of stunting, lost stand, and decreased production) in neighboring agricultural fields. The aerial applications of pesticides were made during February-March 2005 in the western side of the San Joaquin Valley, CA. The area of interest is shown in this fly-through animation (Video 1) in which the colored fields at the end of the animation are the fields of interest (either fields where pesticides were sprayed or fields where damage was claimed).
EnviroComp's Role
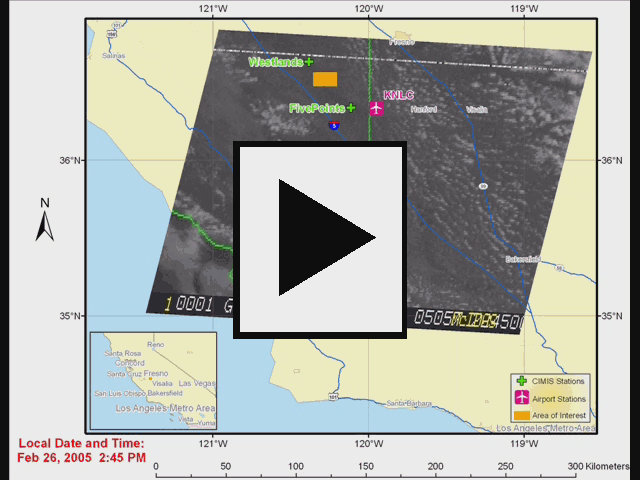
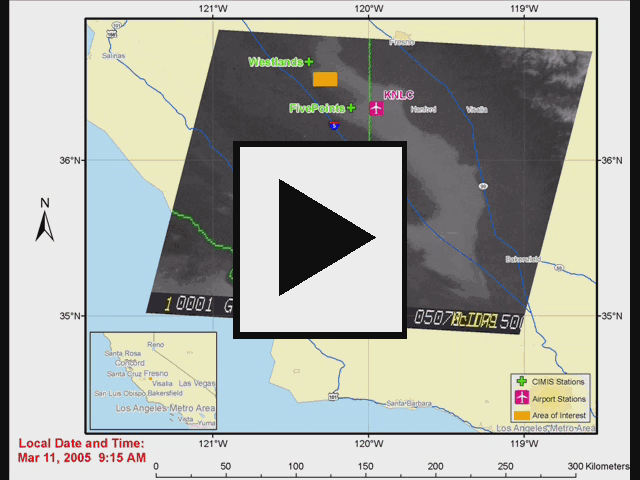
We were retained by the attorneys representing the defendants. We investigated four aerial spray events that could have caused aerial drift. For each event we 1) collected available meteorological data in the region and evaluated the local meteorological conditions; 2) collected satellite images that were combined to perform an animation of cloud motion during the days of the spray events (Video 2, Video 3, Video 4, Video 5); 3) analyzed the Pesticide Use Reports (PUR) and Application Work Orders (WO) to calculate the amount of sprayed material and the time of application; 4) evaluated the characteristics of the spraying event (e.g., aircraft, nozzles, elevation, speed); and 5) calculated a worst-case scenario (maximum extent) for the aerial drift of sprayed chemicals.
We visualized the results by preparing maps with a colored (light blue) area representing the maximum extent of aerial drift based on the physical and dynamical properties of the pesticide droplets. Examples of our results for the four aerial spray events are presented in Figure 1, Figure 2, Figure 3, and Figure 4. These maps provide a clear view of the possible maximum extent of the problem.


