Geographic Visualization, Animation, and Geocoding
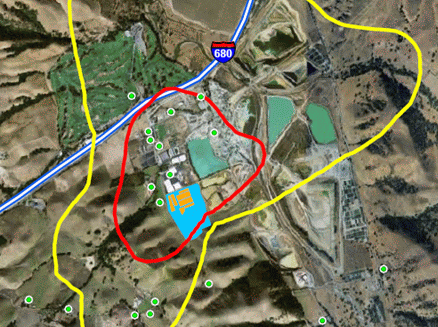
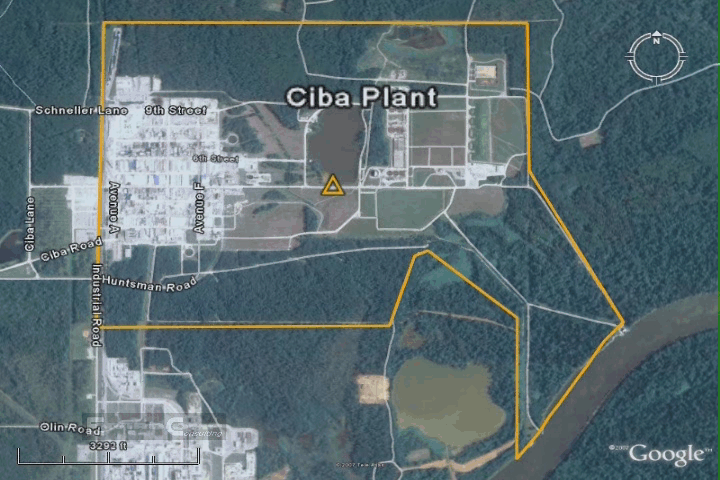
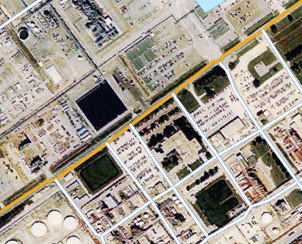
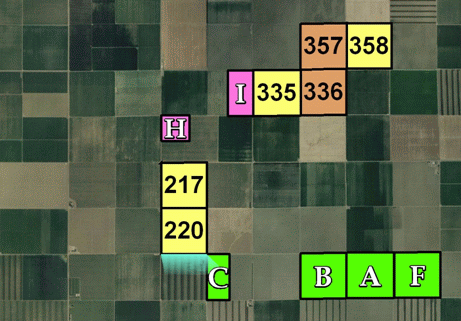
We are very proud of our visualization capabilities. We use the most advanced visualization tools to illustrate our results in technical reports and PowerPoint presentations. All our geographical results are organized and displayed with GIS (Geographical Information Systems) software tools. We often prepare a 3D animation of the site under investigation and the dynamics of the pollution events. We use geocoding software to map points of interests (often thousands of points) from street addresses.
We have developed unique skills and experience in investigating accidental releases in a rigorous scientific manner, yet providing a cost-effective performance.
Selected projects
BioLab Fire
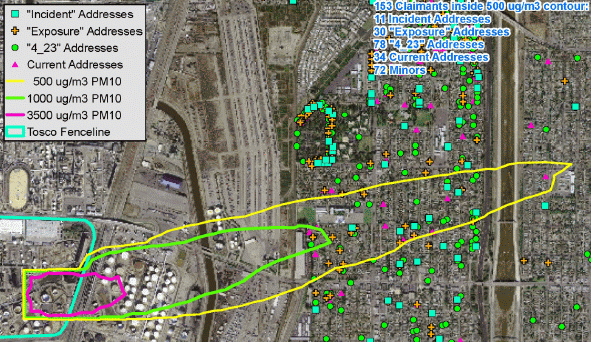
TOSCO-Carson Refinery Fire
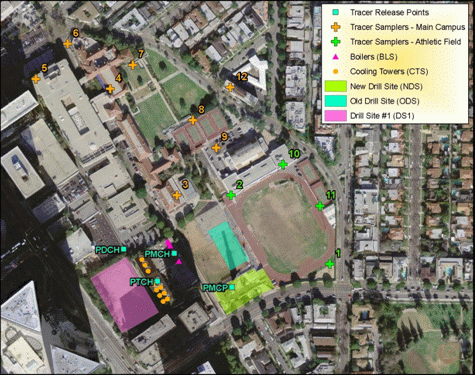
Air Quality Issues in the Beverly Hills High School Area, Beverly Hills, CA
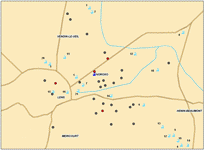
Possible Airborne Contamination of Legionella Bacteria in the Lens Region of France
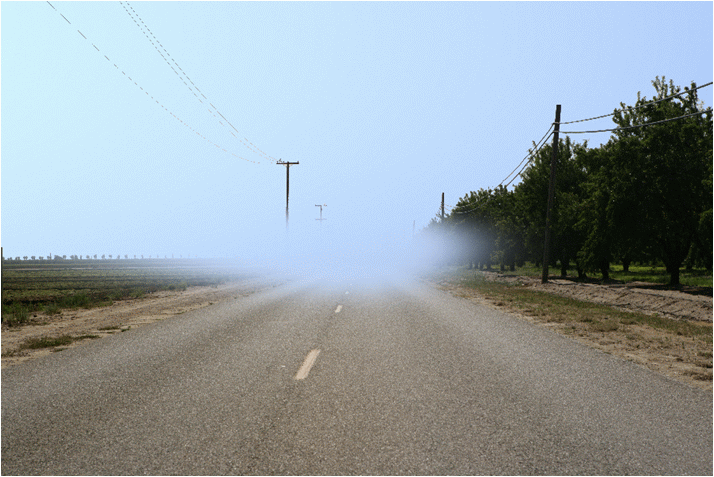
Traffic Collision and Visibility Issues, Fresno County, CA
Proposed Andrade Road Composting Facility in Sunol, CA
Monsanto Case
Highway 5 Traffic Collision
Fisher et al. v. Ciba Specialty Chemicals Corp. et al. - Case Study in McIntosh, AL
The Atmospheric Release on January 5, 2001 from a Chemical Facility in Geismar, LA
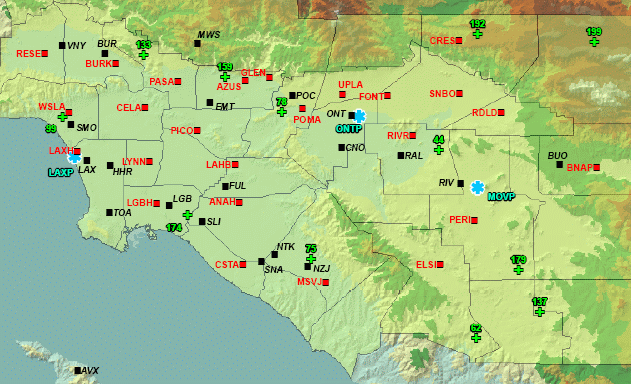
The Development of AERMOD-Ready Meteorological Data for the SCAQMD
EnviroComp developed meteorological input files that will fill the same role for AERMOD as those currently maintained by AQMD for use with ISCST3, to be downloadable by modelers for regulatory applications of AERMOD within the AQMD. [Read More]

